You can read about the change in formula here and Part 1 of looking at changing school data here.
Another school I received questions about–via email and Twitter–was Burley Elementary.
In 2012-2013, Burley Elementary was listed as having:
- 19 total classrooms
- 14 homerooms and 5 ancillary rooms
- Ideal Enrollment = 420
- 2012-2013 20th Day Enrollment = 572
- Space Use Status = 136%
- Considered Overcrowded
In 2017-2018, Burley Elementary (not having moved buildings or undergone any significant physical changes to its facility) is listed as having:
- 24.5 total classrooms
- Ideal Enrollment = 540 (an increase of 120 students since 2012)
- 2017-2018 20th Day Enrollment = 533
- Space Use Status = 99%
- Considered Efficient
This is a significant increase in capacity (120 students!) in the wake of no significant building changes such as an addition.
If we look at the Facility Assessment Detail Report for Burley, we get a more detailed picture of the school to try and determine how CPS may be changing how they are counting rooms in a building.
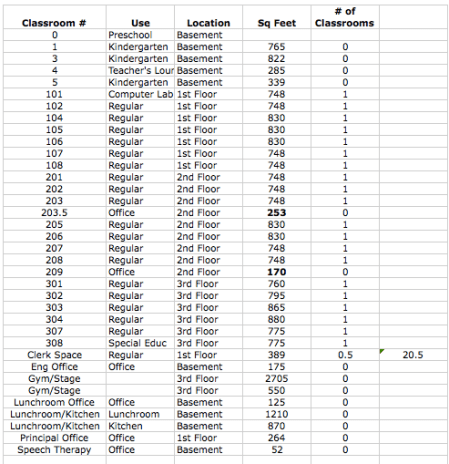
And…well, huh. Even when I count the Clerk Space as 0.5 of a classroom (and that is being really generous to call it even a 1/2 classroom), I’m still only coming up with 20.5 classrooms for Burley. (Because we do not count basement classrooms…right? We didn’t in 2012-2013. See Hamilton.) Not 24.5 classrooms.
So that still seems off, unless Burley has a new addition or annex of some sort that I am not seeing in the data. Or unless they have a basement that is not actually a basement?
Or there may still be mistakes in the facilities data, in which case I am not very confident in the rest of the numbers in this released report.
And if that is the case? My January and February calendar just got a whole lot busier.
Please tell me I’m missing something and this is actually correct. I like my weekends.
