
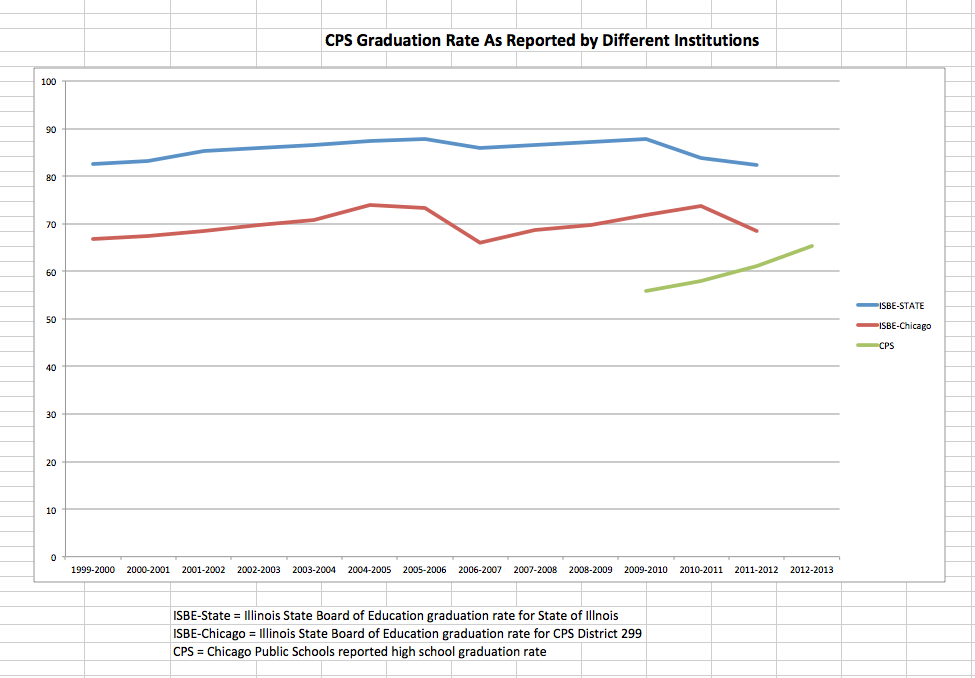
I caught this blog post by Lauren Fitzpatrick of the Chicago Sun Times and it made me wonder…why is the CPS graduation rate trend reported by the District not only different, but trending in different directions?
And it’s less than 10 days before school starts, I’m catching up with the kids, can’t find all of the CPS reported numbers over the same timeline as the ISBE reported numbers.
So, here is the data I’ve found thus far. Anyone have any numbers for me to fill in the blanks?
Then we’ll discuss it.
UPDATE: Well that was quick because Josh Kalov is always ON IT! Here it is:
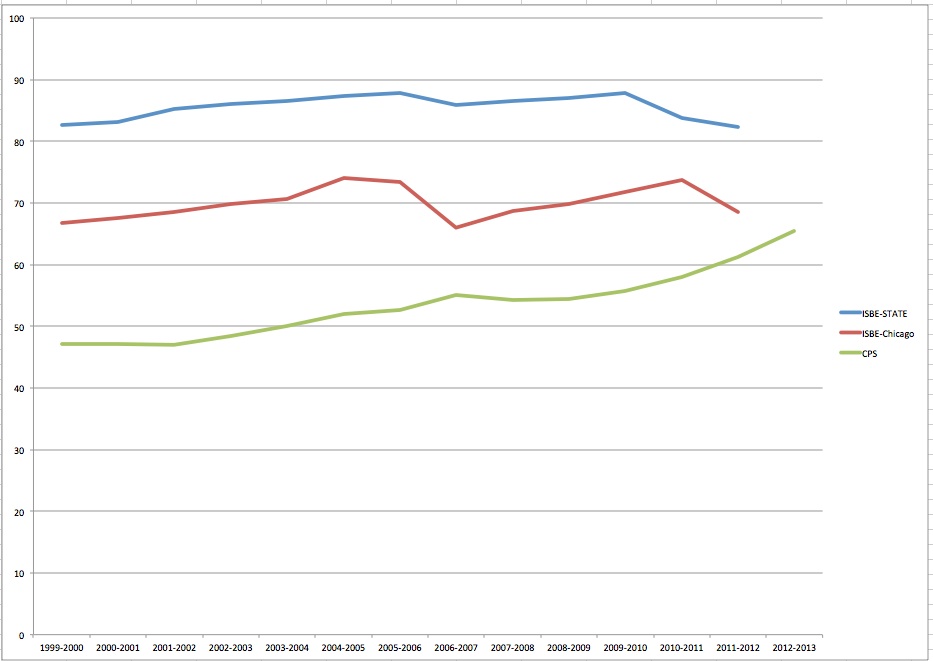

CPS’s number is a 5-year graduation rate. The ISBE number you (and Lauren) are using is a 4-year graduation rate. It probably makes more sense to compare 5 to 5 (or 4 to 4).
Storing here for later use…
CPS’s calculation for 5-year graduation rates: http://cps.edu/Performance/Documents/Datafiles/FiveYearGraduationFactSheet.pdf
CPS’s numbers going back to 1999: http://cps.edu/Performance/Documents/Datafiles/cohort_citywide_1999through2012.xls
ISBE definition: http://isbe.net/assessment/pdfs/report_card/2012/rc12-definition.pdf
DOE Graduation Rate Guidance: http://www2.ed.gov/policy/elsec/guid/hsgrguidance.pdf
I don’t think that is all that is different about the formulas, but let’s go with that for now.
Does it make sense to move the goal posts for Chicago? Would the rest of Illinois be higher with 5-year vs. 4-year measure (I imagine so.) Are we then budgeting in a fifth year of high school as a rule in order to move graduate rates up? When CPS talks about the graduation rate moving up, are they acknowledging at the same time that it is based on 5 years not 4?
Just interesting questions that get at how data is used in calculations, how those assumptions/calculations create different conclusions, and what actions are taken based on the results.
Just another PR gimmick ,like the waiting lists