Got a quick glance at the newly released 2014 budget today and right away something looked a little odd.
Budgets for large organizations can be notoriously complicated, but there are a few high level things that you can look at if you are fact checking the comments by CPS officials about the distance between budget cuts and the classroom:
“Next year’s budget will not come without painful decisions, which is why we are making tough choices at central office in order to minimize impacts to our classrooms,” Barbara Byrd-Bennett, CPS CEO (June 14, 2013)
CPS spokeswoman Becky Carroll said the district was “scraping the bottom” of reserves to provide financial relief and had made cuts in other spending before making layoffs.… “Absent pension reform in Springfield, we had very few options available to us to close that gap,” Carroll said. “This year, given the magnitude and the size of this deficit, and the fact that there was no pension reform reached in Springfield, this has made it to the doorsteps of our schools.” Becky Carroll, CPS spokeswoman via Chicago Tribune (July 19, 2013)
And then there are the numbers on their website:
Budgets by Organizational Unit between FY12 and FY14
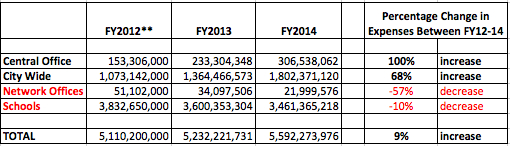
**FY12 budget per unit calculated from CPS FY12 Budget Report which provided District Total Budget and percentages for each unit of total budget. See FY2012 Budget Overview, page 11
We’ve already heard that citywide positions/expenses have increased this year, most likely due to the re-allocation of lunch staff and bus aides from the School budgets to the City Wide budget. That doesn’t explain increases in past years, however.
Why would CPS Officials claim large savings at the CPS Central Office this year (as well as previous years) when their own financial records show relatively significant increases in the Central Office budget (as well as the City Wide budget) over the three years examined?
Possible explanation: Would the increase in the Central Office unit be related to a shift in expenses related to the increase in the number of non-District run schools (charters, contract, alternative schools) from School-Based to other units?
Since these non-District run schools are given a payment by the District to hire and purchase everything that they need–including staff–without needing to disclose their detailed budgets or personnel rosters publicly, the assumption might be that increasing the number of non-District run schools within the District would increase some expenses due to paying the school operators, but would lead to a decrease in the roles associated with schools (fewer teachers and support staff for District run schools) as well as unchanged or fewer roles in the Area Network Office, CIty Wide, and Central Office units.
So let’s test that out.
Positions by Unit
These are the roles attached to different organizational units within the District. within the budget. Our District has the following units that list positions and expenses schools. In general, it looks like this:
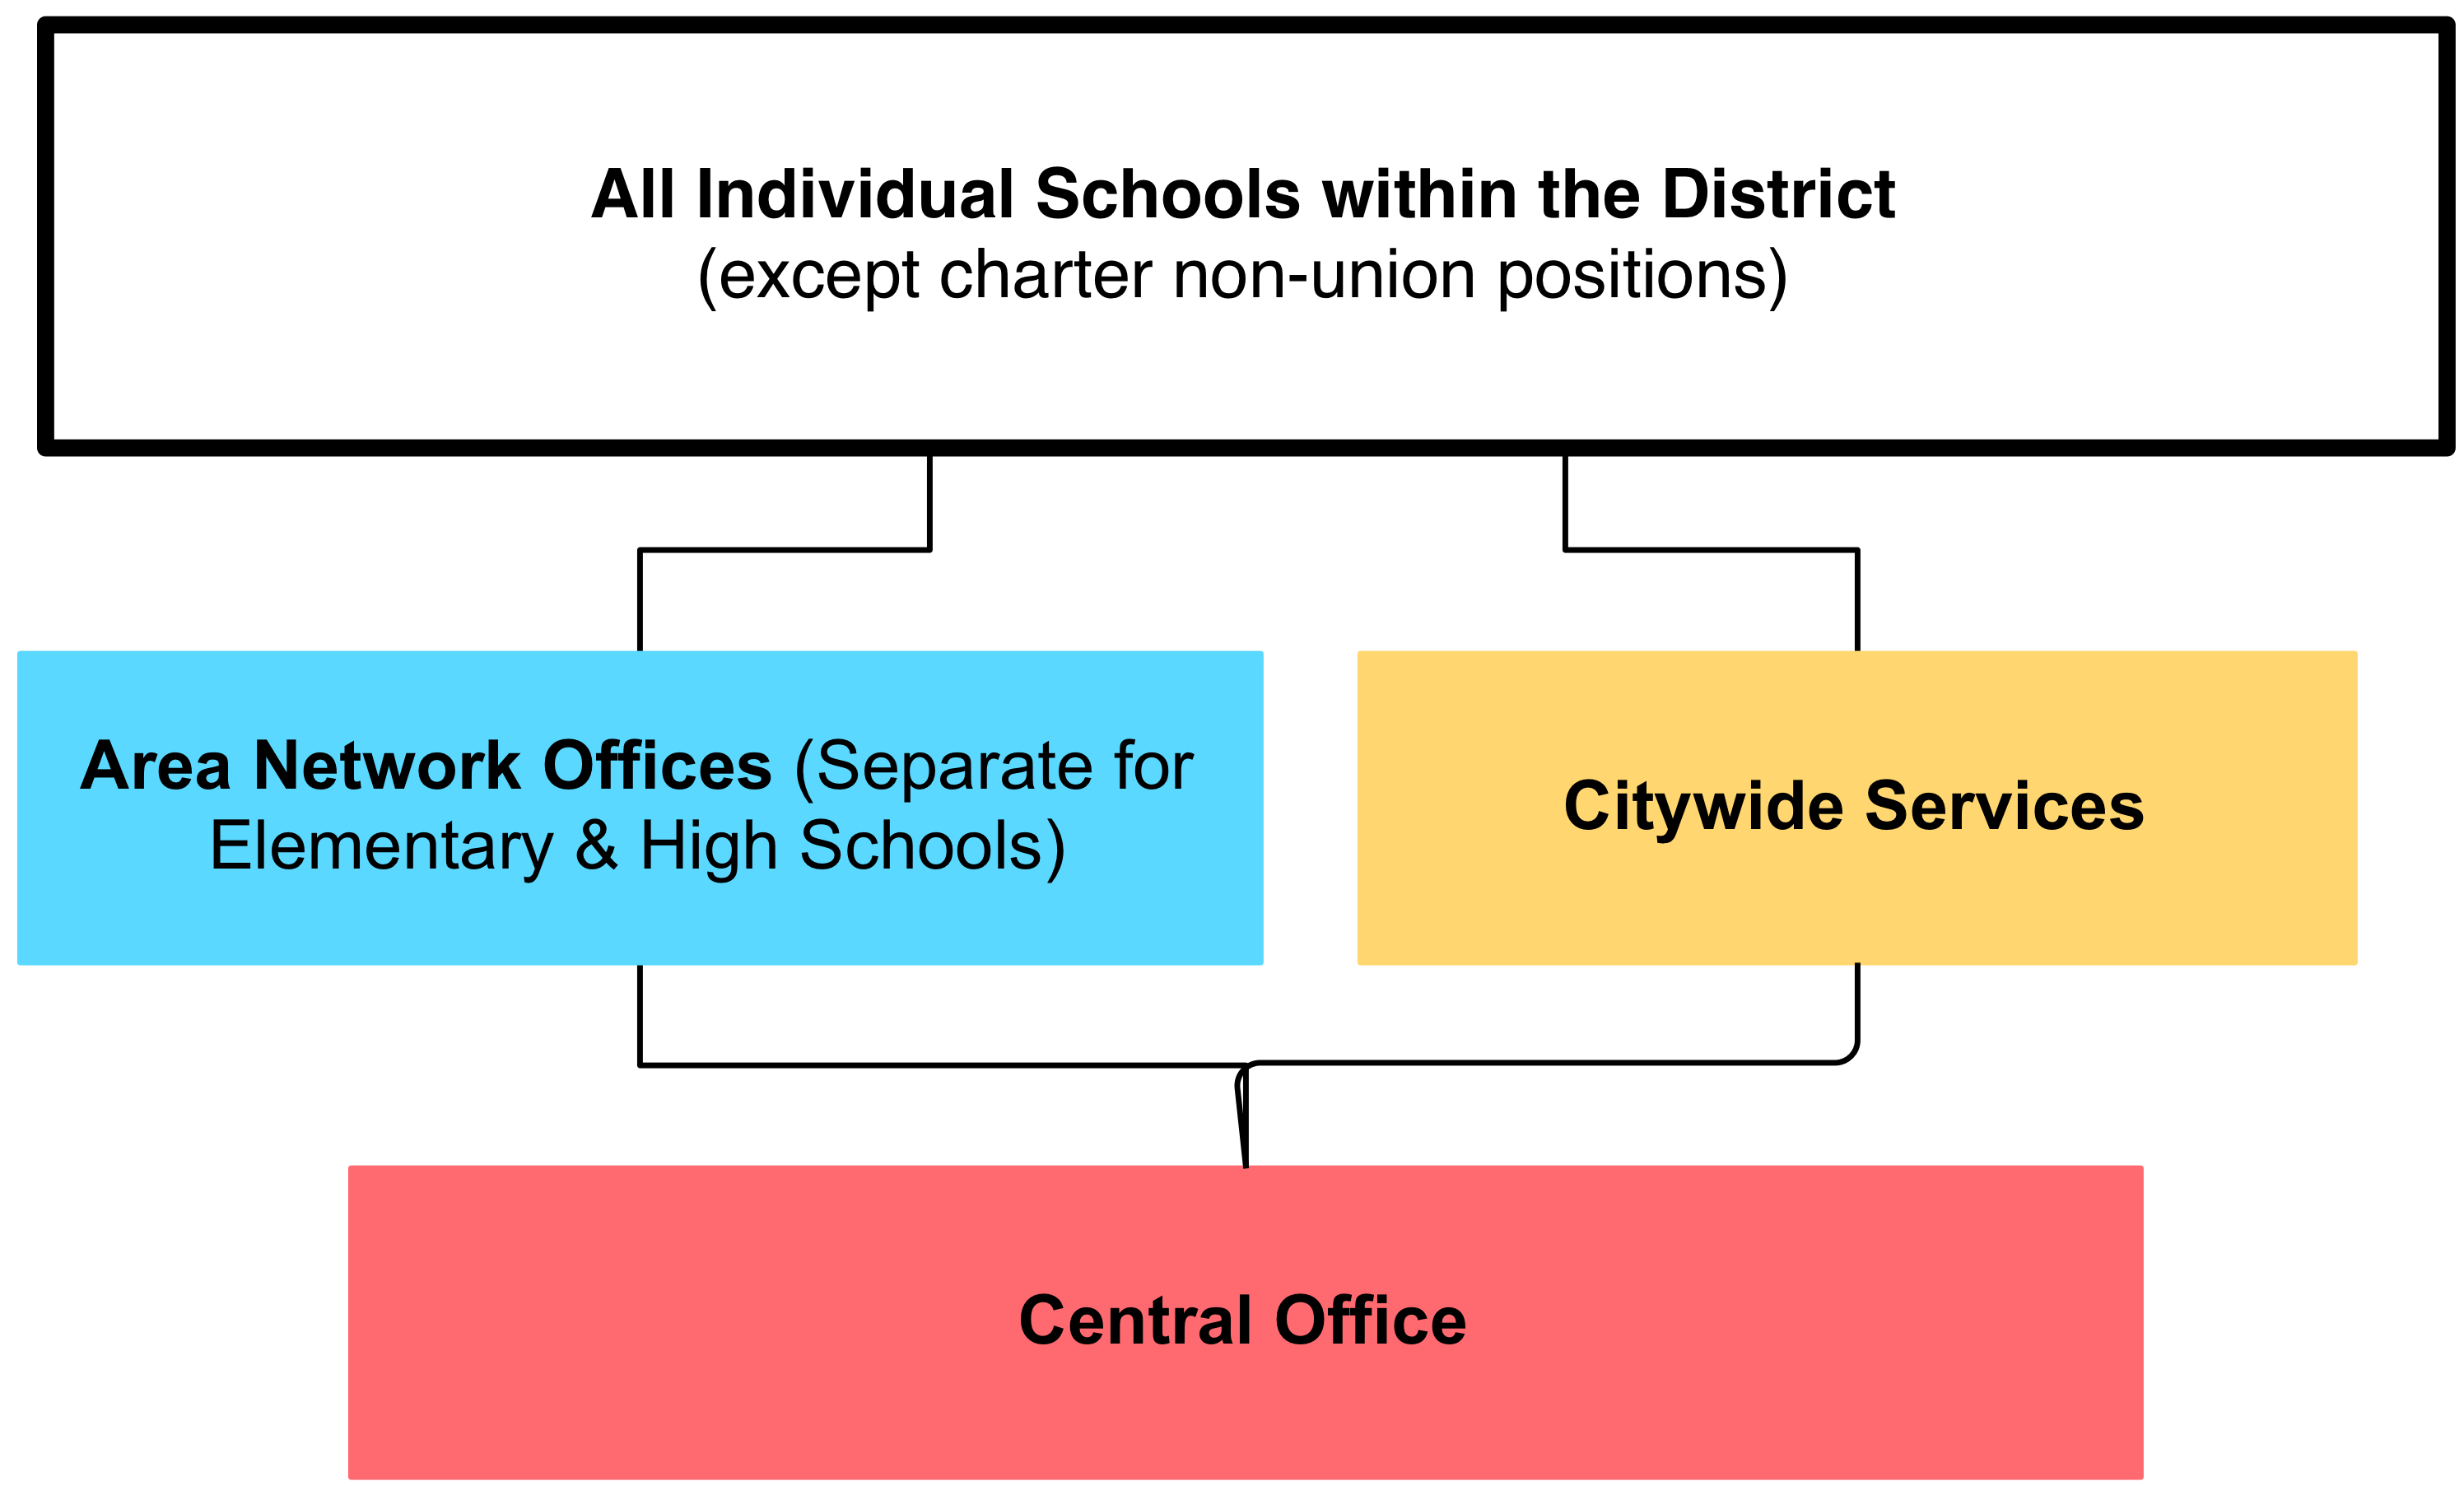
The reason that Central Office is at the bottom of this diagram is related to my understanding from CPS communications that all units in the organization are meant to serve the needs of students in the classroom. The most recent published organizational chart I could find with reporting relationship detail FY2013 looked like this:

Central Office positions reside in the offices of the CEO, the Chief Instruction Officer, Chief of Staff, Math & Science, Arts, CPS Warehouse, JROTC, Assessment, Early Childhood, Early College & Career, etc.
Citywide Services positions reside in different departments, such as City Wide Education General, City Wide New & Charter Schools, City Wide Special Education Resources, City Wide Specialized Service, CPS Warehouse (again), City WIde K-12 Advising, and–as of FY14–lunch staff and bus aides, etc.
Network Offices include those positions that support the schools within a specific geographic area, with separate offices for groups of elementary schools vs. groups of high schools.
All other roles are listed per school and include principals, assistant principals, teachers, special education positions, school clerks, school counselors, etc. This will NOT include non-union positions associated with any charter/alternative schools. As of FY14, this doesn’t include school bus aides or lunchroom staff.
(I don’t have the latest list since the latest round of layoffs, but here is a specific list of roles and titles per unit released on October 1, 2012 which can give you an indication as to the types of positions in each office that year.)
Here is the chart of the budgeted position increases/decreases for those four organizational units since FY2009:
(Click to enlarge)

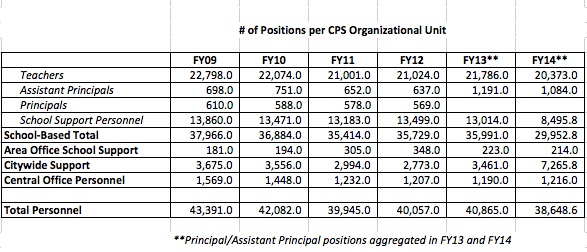
What has led to the increase in expenses at the Central Office unit level if the number of positions allocated to that unit have been decreasing?
Are all of the position and expense increases at the City Wide unit level JUST related to the re-allocation of lunch and bus aide staff positions?
