
To understand the impact of the new Space Utilization formula on one particular elementary school, Haugan, we have:
- Caught up on the new CTU contractual class size maximums which have an effect on the Space Utilization formula for elementary schools;
- Reviewed the different variables that affect classroom space use, and more specifically for Haugan Elementary school, such as percentage/types of services for diverse learners and ELL students;
- Explored how the different admissions situation for Neighborhood Schools affects the use of classroom space, particularly when grades cannot be divided easily into classrooms at the “maximum limit”;
- Unpacked the math behind the new Space Utilization formula and how the Ideal Enrollment is calculated as applied to Haugan;
- Explained why the average classroom limit in the Space Utilization formula should be lowered from 30 to 28;
- Asserted why Efficiency Ranges should be adjusted to defend classroom maximums;
- Explained why the number of Ancillary Rooms for each school should be calculated using a percentage of Total Classrooms (and not Adjusted Classrooms);
- Examined and compared illustrations of Haugan’s space utilization based on the CPS ideal versus the “Real Use” of Haugan’s classrooms;
- Explained how the number of students enrolled by grade (and ELL students within each grade) at Haugan have created a logistical problem for the school when it comes to Space Utilization, and how the current formula actually HIDES the problem.

Having made the suggested changes (30 to 28 average, calculating Ancillary on Total Classrooms) and having corrected a small classification error on the CPS spreadsheet for Haugan Pre-K/Cluster enrollment, I recalculated Haugan’s Ideal Enrollment using the new CPS Space Utilization formula:
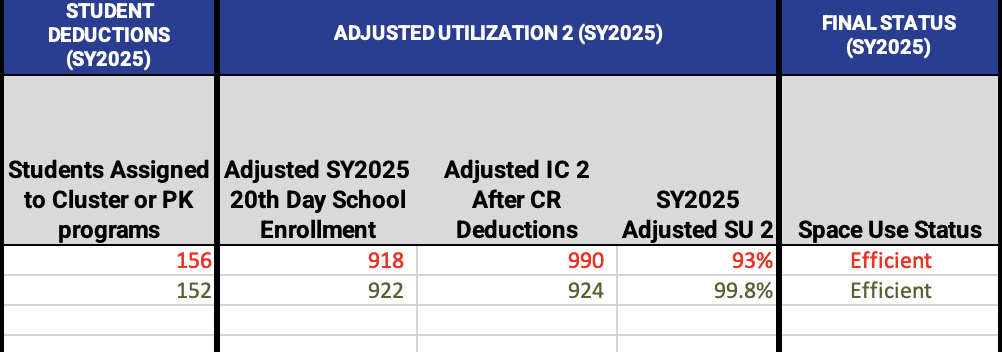
It’s 99.8%. Or if you round up, Haugan Elementary is currently 100% utilized.
Which is great, right? Well, not exactly.
Remember, Haugan’s grade-by-grade enrollments do not divide evenly by classroom maximums, especially when considering the classroom needs of diverse learners (in this case, English Language Learners and IEP learners.)
| Grade | # of Students in Grade (# receiving ELL Services) | Classroom Maximum |
| Kindergarten | 97 (63) | 25 maximum per class |
| First Grade | 93 (50) | 28 maximum per class |
| Second Grade | 93 (43) | 28 maximum per class |
| Third Grade | 97 (36) | 28 maximum per class |
| Fourth Grade | 104 (48) | 30 maximum per class |
| Fifth Grade | 122 (44) | 30 maximum per class |
| Six Grade | 102 (27) | 30 maximum per class |
| Seventh Grade | 101 (19) | 30 maximum per class |
| Eighth Grade | 113 (26) | 30 maximum per class |
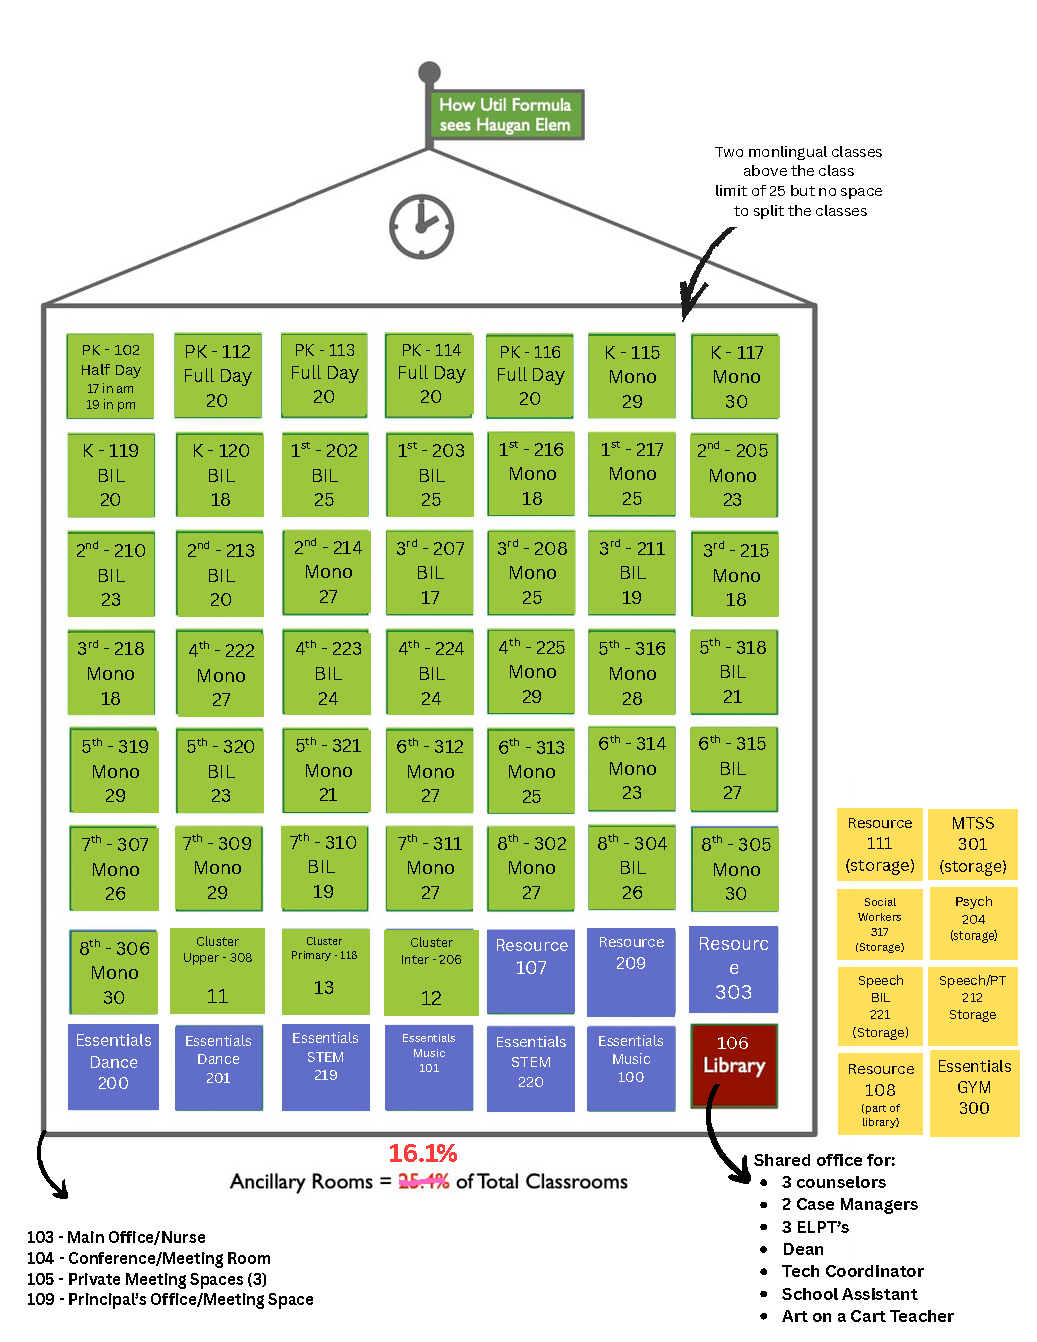
This forces Haugan to either create class sizes over the maximums (in some cases by quite a lot) OR sacrifice needed space for support services and ancillary/enrichment activities for students. (Which we see illustrated here.)
The staff at Haugan seems to have made the best of an impossible situation and prioritize appropriate classroom size and composition for improved student support.
But should they have to continually make these impossible choices? Might there be a better way of doing this?
Neighborhood schools, which cannot control grade-by-grade admissions, need some space to “flex”. In other words, there needs to be an allowance for schools which cannot control their grade-by-grade admissions or, at the very least, a range that signals it is an appropriate time for CPS Central Office to work with the school to give them the space needed.
This is not unheard of, historically. CPS has already used modular classrooms, leased space, co-locations and other solutions to provide temporary “flexible” spaces for schools when needed.
I cannot dictate at what point a Neighborhood School would enter the range of “space assistance” to relieve overcrowding and restore ancillary classrooms. But I will suggest some options:
- When a Neighborhood School exceeds 85% of its capacity and has had to split at least 2 grades unevenly where those classrooms fall under the “ideal” classroom sizes, Central Office should work with the school to discuss options for space relief, or
- When a Neighborhood School exceeds 85% of its capacity and has lost more than 10% of its ancillary classrooms to support services and/or the splitting of classrooms to maintain classroom maximums, Central Office should work with the school to discuss options for space relief, and
- When the percentage of a Neighborhood School’s IEP students exceeds the District Average, the number of Ancillary Rooms allotted to the school should increase by 1 Ancillary classroom for every 5% of IEP students.
Why 85% or 10% if these are “arbitrary” numbers? Maybe there are better numbers. Maybe I’m even being too conservative. After all, classroom sizes of 28 or 30 in different grades are arbitrary numbers. And 23% of Total Classrooms being credited to Ancillary use is an arbitrary number.
However, I would argue that these are not “arbitrary” numbers because they do reflect a certain expression of what an organization values. They signal what elements an organization is willing to protect, and what elements will be sacrificed.
Which is, after all, why the formulas used by Chicago Public Schools will always be interesting to me. They are an expression of what is valued in public education in Chicago.

Pingback: Space Utilization in Practice: Ideal vs Reality | Apples 2 Apples in Chicago Public Schools